When I first heard the word “machine learning” I was imagining a robot that I feed some data and that just learns without me doing anything. Doesn’t that sound promising? Why program if a machine can learn for itself? That should be enough to get interested in the subject.
A good way to start learning about machine learning (ML from now on) is by doing the Coursera online class1. I finished that and what follows are what I have learned in simple terms.
Definition
Definition of ML given by Tom Mitchell (1998):
A computer program is said to learn from experience E with respect to some task T and some performance measure P, if its performance on T, as measured by P, improves with experience E.
So here we have it. Experience E is past data. Some task T is what we want to accomplish. And of course we need measurement P to know how we are doing and to tell if we actually progress.
Supervised and unsupervised learning
There a two types of ML applications that depend on what kind of data the learning algorithm is supposed to work on. One type consists of data of which we know what the “right answer” is. This is called “supervised learning”. A typical example are housing prices. Take house sizes, number of bedrooms, age and so on and predict how much a house will sell for. We know the exact result of such a prediction because it is all in the data.
The data of unsupervised learning on the other hand has no clear answer. The solutions we get from this kind of scenario are grouping of data or clustering. It is trying to find a hidden structure in data.
Learning algorithm
So now that we have data (any of the two kinds) we want to feed our algorithm with it. But what algorithm do we choose? Here comes the statistics part of ML into play. What we are going to use are methods of regression analysis 2, namely linear regression and logistic regression.
Linear regression
To understand the basic idea of linear regression3, let’s assume we have 2-dimensional data like the prices of houses compared to the estate area in square meters. If you plot the data on a 2D coordinate system, a pattern emerges:
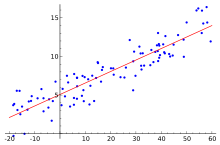
A good algorithm would be one that “comes close” to the pattern of the data: the red line.
This curve is called our hypothesis as it represents our estimate of how to express the data.
But how do we know if our hypothesis is good? In the words of Mitchell, what is our performance measure P?
That is actually quite easy to tell. Just measure the difference between our estimation/hypothesis and the real data. How do you do that? In linear algebra, the difference between two points is the euclidean distance, which is basically the shortest line between two points. The sum of all the distances is called cost function and that is our performance measure.
What is left to do is to minimize the cost function and then we have the optimum learning algorithm.
A lot of the course deals with optimization and the different forms of hypothesis functions we can choose.
Logistic regression
So far we have talked about continuous type of data, like price. To deal with binary data or classification we need a different kind of hypothesis, one that is not continuous but gives us discrete output.
This is the field of logistic regression. Our hypothesis function we use is the so called sigmoid function4:
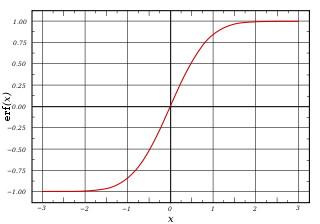
This function goes from -1 to +1. If we define a threshold T, we can assign an output value for f(x) <= T and f(x) > T which gives us the binary output. Again we formulate a cost function and do different kinds of optimization.
Optimization
The basic ingredients of ML are all well known statistical tools. One emphasis of the course is to give a blueprint of how to use the tools. This is the optimization part which makes up the most of the course.
The basic question is this: imagine we have a linear regression problem and come up with following three hypothesis:
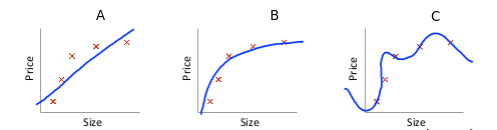
Here we can see three basic problems we face:
- A) underfitting/bias: our learning curve hardly follows the real data. We are under fitting it or have high bias.
- B) good: this curve seems to be a good fit
- C) overfitting/high variance: our hypothesis is too exact, we are overfitting or having high variance.
There are several strategies to overcome bias or variance. Adding regulization, more parameters, more data and so on.
Other subjects
The course has 18 lectures in total. It gives a broad overview about ML. Other subjects are:
- Neural networks
- Clustering using k-means
- Dimensionality reduction
- Support vector machines
- Anomaly detection
- Creating a recommender system
- Learning with large data sets
- An example application of OCR
The exercises
As typical for Coursera classes, there are two kinds of exercises: review questions and programming exercises. The review questions can be repeated as often as you like and change a little every time. I found this to work quite well, especially if trying to get the maximum points.
Then there are the programming exercises. They form the main part of the course. The tasks have to be programmed in either Matlab or Octave.
Personally, I was not very happy with the exercises. I felt there has been a gap between the lectures and the problems that have to be solved in Octave. Some exercises are quite simple, others rather difficult if you don’t know how to approach mathematical problems using a programming language.
Thinking in matrices
The difference between solving problems using a language like Java, Python, Ruby etc and Octave is, what I call, “to think in Matrices”. Many tasks can be solved using an imperative way but the real power of Octave is vectorization of the solution, that is, to solve a problem by applying methods of linear algebra (eg. matrix multiplication). This can be a challenge at first but it does help a lot coming up with elegant solutions.
Conclusion
ML is a huge field. It is easy to get drowned in math but the Coursera course circumvents that by always following practical examples and having the programming exercises to solve. Personally, I’d prefer a more focused approach instead of trying to be very broad but the good thing about this course is that with the first lessons you have already enough to get started in the field. Maybe see you soon doing a Kaggle competition?
See also: Why you should try a MOOC